One of my favorite tools for visualizing building information is Tableau. All you have to do is give it a data source and you are able to very quickly visualize it. I’ve made other posts here about it…
In this case, I’m using our Excel link to Revit, Exceler8 (aptly named by our own AYBABTM) as my main source of data since it is very quick and I can get more information that I can directly from Revit schedules. Also, Tableau can connect directly to an .xls file so it is convenient on that side too.
I’m going to export the category ‘Rooms’ since that’s what I’m looking to visualize. The objective here is to have model data directly drive some graphics that I need to put into a project document that is not model or drawing based, probably in Word or InDesign.

Make sure to select the ‘As Text’ option on the Parameter Value Configuration, otherwise we’ll need to do a bunch of clean up in excel which we want to avoid. Also, make sure to grab both Type and Instance parameters.
Over in Tableau, you want to Connect to Data and select the file you just saved out. The default option will be to select a single table (workbook) within that file.
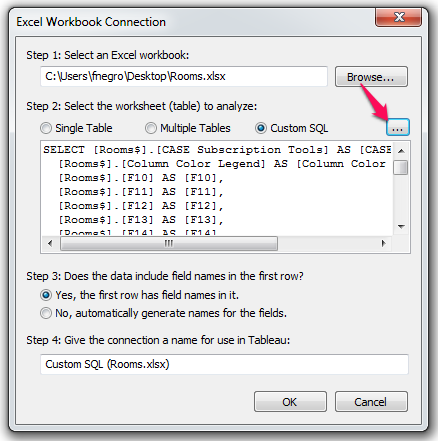
This would work fine if the first row of our excel file had field names, but Exceler8’s field names are on the 8th row. We’ll need to use the Custom SQL option to call a particular named range, or in this case to explicitly call out which cells we want to bring over.
You’ll notice that Tableau has already written code that will bring over whatever table we had selected before we switched the custom SQL option. This is a really nice shortcut to learn how it’s trying to understand what’s in the source file and how it’s trying to bring it over. In this case, it’s reading the column headers as field names which we know is incorrect.
What we’ll have to do is select all and delete the query that Tableau wrote for us, and paste this in instead:
SELECT *
FROM [Rooms$A8:Z500]
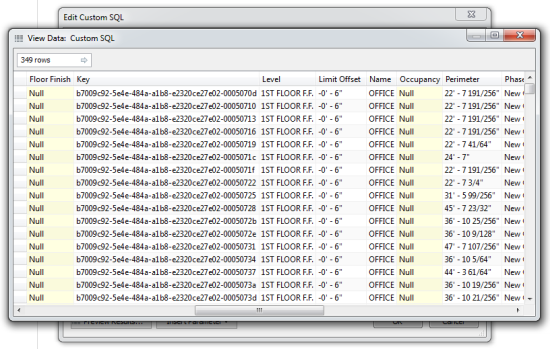
What this will do is to select all fields (*) from Rooms starting at A8 through Z500. I chose 500 as a number that was obviously larger than the number of Room elements in my model. We then check the ‘Preview Results’ button to test our query and make sure it is working.
The result should mimic what we have in Excel. So, without any reformatting at all, we were able to drive down into a specific range of cells in Excel for our use. By selecting the ‘Connect Live’ option, any updates to the data that happen on the Excel file over time will be able to be reloaded without any problem into Tableau.
All our dimensions and measures are now exactly how we want them for visualizing. From here you can just drag and drop into the worksheet to visualize the data you want. Here are a couple of examples:
Example 1: This is simply a tabular view listing each of the Revit elements that exist with a particular name. You see Revit’s internal GUID as well as the square footage of that room. We are also formatting the cell to conditionally color from smallest to biggest area.
 Example 2: This is a bubble chart that is meant to visualize proportions between the different space types. In this case we are not viewing every instance of a room type but instead are comparing an aggregation of all the Rooms with a particular use against another. The number of bubbles represent that number of ‘Uses’ represented in the model, and the size of the bubble represents the aggregate area of all the Rooms in that Use category.


