One of the more useful applications of building information we’ve been experimenting with has been visualization. We first started experimenting with visualizing building data back in 2010. You can see a presentation I gave at KA Connect 2010 on the research we were doing on this front with SOM here. The research we did on that project has evolved into a full fledged web based tool that is helping them manage their thousands of gigs of BIM data production.
Since I’ve become obsessed with other applications of visualization. Let’s look at what it can do to clash detection or conflict analysis. This is an area I spend a lot of time on since it is at the core of our Project Consulting services. Model progress comparisons, conflict analysis, audits, craft, etc… are all critical parts of the continuous BIM data management responsibilities that go along with BIM project delivery.
Of course, the objective behind visualization is to help emerge some other interpretation of the data that can provide further insight, whether it be through a new pattern that is recognized, grouping, or something else. It must teach us something new by viewing the data from a different perspective.
Here are a couple of examples:
1. Plotting the x and y coordinates of clash instances
clash detection visualization by x and y coordinates
Though seemingly obvious, the above image helps us tremendously to quickly understand a simple clash test. By plotting the x and y coordinates of each clash instance, and coloring them by the discipline, we are able to quickly identify the area and model that have the most issues. On the image above, the lighting model has an area of severe congestion on the north-east of the building. Without having gone through every clash, I already understand, at a high level, where most of my time should be spent.

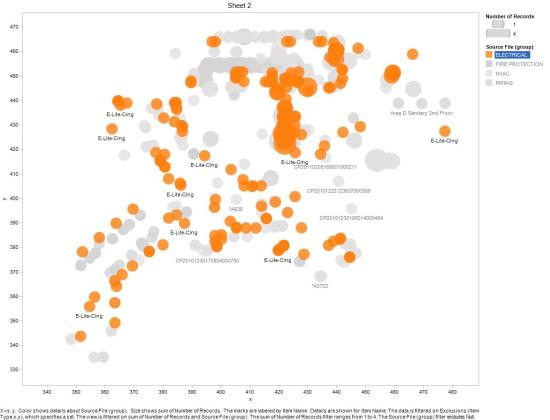
Conflicts by x and y
Similarly, on this analysis we see an x y plot that quickly categorizes the source files of the clashes by color, labels the elements by name, and indicates the severity of the clash by the size of the bubble. This analysis looked at conflicts between curtain wall components against the building’s superstructure.
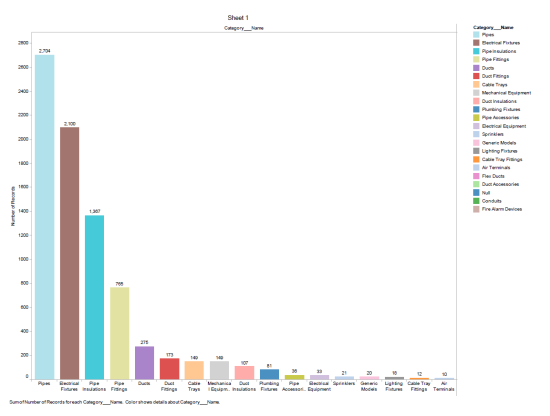
2. Ranking BIM elements by number of conflicts and severity

BIM visualization by element clash severity
This image takes each distinct BIM element and ranks it based on number of identified conflicts and sizes them by severity. From this, we are able to quickly assess the type of elements that may need the most amount of attention. Not to imply that clash quantity is the single source for qualifying a coordination issue, it is not, but elements that have a high number of clashes of high severity should be addressed.
3. Model version comparison analysis
BIM version comparison
In this case, we are comparing one model version versus a previous one. We are interested in seeing how much, and what has changed between submissions. We see, very quickly that on this MEP model, most of the work has gone into re-routing plumbing systems and relocating electrical fixtures. This can be incredibly helpful on large projects to understand model progress and keep an eye on craft.
