How to connect Tableau and Exceler8 to visualize building information

One of my favorite tools for visualizing building information is Tableau. All you have to do is give it a data source and you are able to very quickly visualize it. I’ve made other posts here about it…

In this case, I’m using our Excel link to Revit, Exceler8 (aptly named by our own AYBABTM) as my main source of data since it is very quick and I can get more information that I can directly from Revit schedules. Also, Tableau can connect directly to an .xls file so it is convenient on that side too.

Exceler8

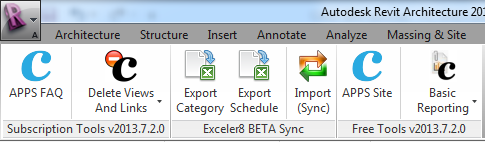
I’m going to export the category ‘Rooms’ since that’s what I’m looking to visualize. The objective here is to have model data directly drive some graphics that I need to put into a project document that is not model or drawing based, probably in Word or InDesign.
Exceler8 Interface

Make sure to select the ‘As Text’ option on the Parameter Value Configuration, otherwise we’ll need to do a bunch of clean up in excel which we want to avoid. Also, make sure to grab both Type and Instance parameters.

Tableau - 01

Over in Tableau, you want to Connect to Data and select the file you just saved out. The default option will be to select a single table (workbook) within that file.

Tableau - 02

This would work fine if the first row of our excel file had field names, but Exceler8’s field names are on the 8th row. We’ll need to use the Custom SQL option to call a particular named range, or in this case to explicitly call out which cells we want to bring over. 

Tableau - 04

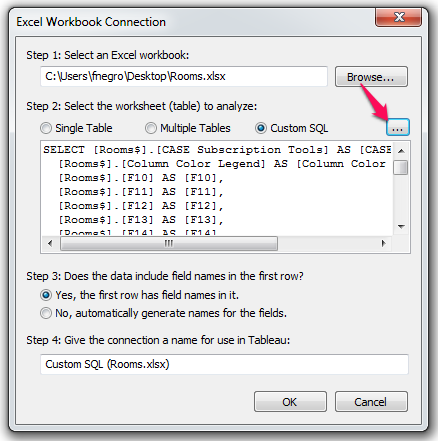
You’ll notice that Tableau has already written code that will bring over whatever table we had selected before we switched the custom SQL option. This is a really nice shortcut to learn how it’s trying to understand what’s in the source file and how it’s trying to bring it over. In this case, it’s reading the column headers as field names which we know is incorrect. 

Tableau - 05


What we’ll have to do is select all and delete the query that Tableau wrote for us, and paste this in instead:

SELECT *
FROM [Rooms$A8:Z500]

What this will do is to select all fields (*) from Rooms starting at A8 through Z500. I chose 500 as a number that was obviously larger than the number of Room elements in my model. We then check the ‘Preview Results’ button to test our query and make sure it is working. 

Tableau - 06


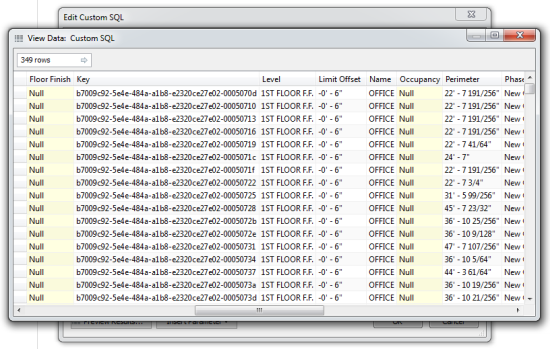
The result should mimic what we have in Excel. So, without any reformatting at all, we were able to drive down into a specific range of cells in Excel for our use. By selecting the ‘Connect Live’ option, any updates to the data that happen on the Excel file over time will be able to be reloaded without any problem into Tableau.

Tableau Revit


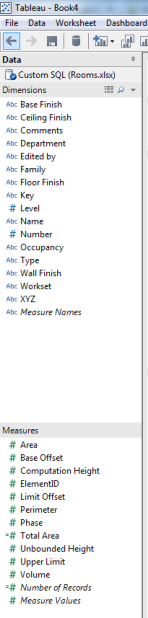
All our dimensions and measures are now exactly how we want them for visualizing. From here you can just drag and drop into the worksheet to visualize the data you want. Here are a couple of examples:


Tableau Revit


Example 1: This is simply a tabular view listing each of the Revit elements that exist with a particular name. You see Revit’s internal GUID as well as the square footage of that room. We are also formatting the cell to conditionally color from smallest to biggest area.


Revit tableu by levelExample 2: This is a bubble chart that is meant to visualize proportions between the different space types. In this case we are not viewing every instance of a room type but instead are comparing an aggregation of all the Rooms with a particular use against another. The number of bubbles represent that number of ‘Uses’ represented in the model, and the size of the bubble represents the aggregate area of all the Rooms in that Use category.


Make your own way

A couple of weeks ago I took part in the yearly Intersections Symposium held by the Fuse Lab at Citi Tech. I was part of a panel (aptly) named “Tools” (?) with Axel Killian from Princeton SOA, David Rife from ARUP Assocites, and Jonatan Schumacher from Thornton Thomasetti. It was great to get a chance to catch up with these guys and recommend you follow their work where you can.

The central question posed to the panel was ‘how are students to prepare and keep up with the fast moving advance of digital tools?’  It’s a great question and one that has been a big part of the professional world as well. The explosion of digital tools in the last decade has had a profound impact in practice just as much as it has in the academy. We hear a lot today (…has it been 6 years??) about BIM and how this process is changing the established workflows. For some reason, we did not hear as much about the effect that Rhino (+ Grasshopper) and SketchUp  also had on our industry. I sense these were more disruptive technologies in their day, giving access to cheap or free 3D modeling to designers en masse.

Tinkering and architecture

In any case, David, Jonatan and I, the three non-academics on the panel, all took a similar approach to the topic, presenting concepts and examples of pushing past limitations of commercially available tools to find workflows and solutions for a our projects.

My part focused on defining the difference between tools and workflows. A workflow being defined as a series of connected steps, or a recipe as Dave Fano would call it. A tool (a digital tool in this case) is the means by which we perform any one of those steps in a way that is both efficient and yielding high quality. A good workflow will re-purpose tools in ways their makers never imagined. A good workflow has a purpose.

At the time of the symposium and only a few months after the site launch, AEC Apps already lists more than 425 tools. This number is made up of both highly successful commercial products and one off hacked-together add-ins made by many of us. My sense is that this number is still low, but it already begins to expose the magnitude of options that we as designers have every day in tool selection as we design the workflows that enable our design process.

Apps listed on AEC Apps

Some may see this as a problem, and will call for consolidation of options to a select few. They will do so in the name of inter-operability or standardization, but this is the wrong move for AEC.

An industry in dire need of more applied research should find ways to to add fuel to the fire and encourage designers to continue to take on tool-making as part of the design process, while also challenging software vendors to continue to innovate. But we shouldn’t stop there. We also need to share more. Sharing our experiments or tools, whether they be a model jig, a good family, a few lines of code, or even a polished add-in does much to push us all forward. It is through these examples and the conversations that happen online that we learn, adjust and forge ahead.

The underlying lesson of the talk was that emphasis must be given to the problem being solved, and not the tool. The question is not ‘what does the tool enable us to do?’, but instead, ‘what do we want to do, and how can these tools help us get there?’. By refocusing the conversation on solving real building problems we will find it much easier to make decisions about which tools to use, and when it may be worthwhile to even build your own.

IMG_0338

Thanks to Brian Ringley for the great photos.

Thanks to NY City Tech for the invite. I had a lot of fun. If you’re interested in all the work that is happening over there, have a look:

http://openlab.citytech.cuny.edu/fuselab/

@NYCCTfab

http://www.nycctfab.com/

http://www.flickr.com/photos/nycctfab/with/8949366921/

Some Examples of How BIM Data Can Help Us Make Better Decisions

This is a presentation I gave at last year’s AIA TAP at CIFE. It was a short presentation on some of the potential benefits of mining BIM data and studying it to help emerge some truths, patterns, etc. about our projects, processes and our teams. I showed some specific examples on how we are using some of this data today to make more informed decisions.

Archiving and search

One of the lowest hanging fruit of all this is the idea that if we can access all the information that is stored in these models, we can literally search through our past projects. Imagine being able to search for what doors or what floor to floor height were used on a building you finished 5 years ago, without having to run down to the archives.

Comparative analysis

It is common for us as industry to use precedents, but most of the time we are limited by relatively obvious attributes in our selection. We use things like typology, project size, client, client type and region as good meta organizers. What if we wanted to take that further? What if we wanted to identify projects by their floor to floor heights? or, what if we wanted to identify projects by the use of some particular piece of mechanical equipment? By that same measure, what could we learn if we could take successful projects and compare them against those considered to be less successful?

Smarter QA/QC

When working with large models and large teams, knowing ‘what is in the model’ can be almost impossible to determine. The rate at which people are adding elements is faster than the speed at which we can check them. Our qa/qc tools are not in line with our speed of production. Running model checks against a set performance standard is another big opportunity here. The information is there, we just need to be able to see it in the right form, and it needs to come to us at the right speed. It needs to keep up with production.